Differences in Life Satisfaction among Older Adults in India
Chapter Contents
Key Insights
- Older age is associated with higher life satisfaction in India, refuting some claims that the positive association between age and life satisfaction only exists in high-income nations.
- On average, older men in India are more satisfied with life than older women (Table 5.1), but when taking all other measures into account, older women report higher life satisfaction than their male counterparts (Table 5.2).
- Older adults with secondary or higher education and those of higher social castes report higher life satisfaction than counterparts without formal education and those from scheduled castes and scheduled tribes.
- Satisfaction with living arrangements, perceived discrimination, and self-rated health emerge as the top three predictors of life satisfaction in this study.
India’s older population is the second largest worldwide, with 140 million Indians aged 60 and over, second only to its 250 million Chinese counterparts.[1] Additionally, the average growth rate for Indians aged 60 and above is three times higher than the overall population growth rate of the country.[2] Though population aging reflects social and economic progress, scientists across the globe continue to debate the factors that contribute to quality of life in older age.
Life satisfaction, which is the best indicator of quality of life[3] reflects the subjective assessment of one’s life as a whole. Although participants, when inquired, rate their present quality of life, life satisfaction in older ages may serve as a measure to evaluate whether one’s life has been successful overall.[4] Older adults with higher life satisfaction report healthy behaviors,[5] which translates into better overall health.[6] However, it can become difficult to maintain higher levels of life satisfaction with advancing age, often accompanied by social, physical, and mental health challenges.[7] As such, zeroing in on the factors that contribute to life satisfaction is central to creating policies and programs that can improve the quality of life in older ages.[8]

A systematic review of 24 studies among older adults (60+ years) in Asian countries, including India, has identified age, gender, social relationships, social engagement, living arrangements, education, income, caste, religion, health behaviors, health conditions, and health care to affect life satisfaction in later life.[9] Few studies have examined life satisfaction among older adults in India, yet those that have found that factors such as poor childhood, financial status, lack of social support in late life, physical frailty, and feelings of loneliness are associated with lower levels of life satisfaction.[10] However, past studies have focused on particular factors determining satisfaction with life in old age, meaning that comprehensive assessment of diverse predictors of life satisfaction among older men and women in a gendered sociocultural context of India remains limited. In this chapter, we strive to fill this gap by estimating the extent to which various sociodemographic, household, and health-related factors contribute to the differences in life satisfaction among older adults in India.
Though population aging reflects social and economic progress, scientists across the globe continue to debate the factors that contribute to quality of life in older age.
Methods
Data
This chapter used the baseline wave of the Longitudinal Aging Study in India (LASI, 2017-19), which is the Health and Retirement Studies’ (HRS) Indian adaptation.[11] The LASI provides vital information on demography, health symptoms, conditions, disabilities, health service utilization, household socioeconomic status, family and social networks, and life expectations of 73,396 adults aged 45 years and above.[12] LASI used a multistage stratified area probability cluster sampling design to arrive at the final observation units: older individuals aged 45 and above, as well as their spouses of any age.[13]
This study used a sample of 31,902 individuals aged 60 and above, whom we refer to as “older adults” from here on forward. The sample who responded to the questions on life satisfaction totals 30,795 older adults.
Outcome Variable
All respondents reported their life satisfaction, which served as this study’s primary outcome variable. Life satisfaction is defined as a person’s cognitive appraisal of their life as a whole. [14] During LASI round-I, the interviewers collected information on the following five life satisfaction indicators:
- In most ways, the respondents’ life is close to ideal.
- The conditions of the respondents’ life are excellent.
- The respondents are satisfied with their lives.
- The respondents have achieved the essential things they want in their lives so far.
- If the respondents could relieve their life, they would change almost nothing.
Ratings were provided on a scale ranging from 1-7, where one meant strongly disagree and seven meant strongly agree. The life satisfaction score[15] of older persons, which ranges from 5-35, was then calculated by adding the five indicators with greater scores implying higher levels of life satisfaction. To maintain comparability and continuity with life satisfaction measures used in other chapters of the World Happiness Report, we transformed this life satisfaction variable into a 0-10 scale by subtracting 5 and then dividing by 3. Notably, the average Indian older adult scored 6.32 points in the life satisfaction scale. It is worth pointing out that life satisfaction in our study is self-reported, thus there always lingers the possibility of misreporting due to the fear of social stigma.
Explanatory Variables
Given their relevance to older adults’ life satisfaction, we included sociodemographic, health, and household characteristics in this study. The sociodemographic characteristics of the older adults are:
- Age group was coded as young-old (60-69 years), old-old (70-79 years), and oldest-old (80+ years).
- Gender was coded as male and female.
- Level of education was coded as no formal education, up to primary, secondary and above.
- Work status was categorized as never worked, currently not working, currently working, and retired.
- Marital status was coded as currently not married and currently married.
- The importance of religion was coded as not important and important.
- Living arrangement satisfaction was coded as satisfied, neutral, and not satisfied.
- Victim of ill-treatment (within one year of the interview) was coded as no and yes.
- Perceived discrimination was coded as no and yes.
- Social participation was coded as: socially active and socially inactive. The family and social networks module of the LASI survey questionnaire includes detailed questions about older adults’ participation and engagement in social activities, organizations or society. The survey asked participants whether they were a member of any of the organizations, religious groups, clubs, or societies from a given list and how many meetings/regular gatherings, if any, they attend in a year. Older adults who engage in the above social activities were classified as “socially active” and otherwise as “socially inactive.”
The next set of variables included the following health-related characteristics of older adults:
- Depression symptoms were coded as: 0 “Not depressed” and 1 “Depressed.” Major depression among older adults with symptoms of dysphoria was calculated using the CIDI-SF (Short Form Composite International Diagnostic Interview), with a cut-point of 3 on a scale of 0-10.[16] This scale estimates a probable psychiatric diagnosis of major depression and has been validated in field settings and widely used in population-based health surveys.
- Self-rated health was coded as good, average, and poor.
- Chronic morbidity was coded as: no condition, single condition, or multiple conditions. LASI collected information on whether an older adult was ever diagnosed with hypertension or high blood pressure, diabetes or high blood pressure, cancer or malignant tumor, chronic lung diseases, chronic heart diseases, stroke, bone, or joint diseases, any neurological or psychological problems, or high cholesterol. Individuals having no diseases, any one of the diseases and two or more diseases were categorized into “no condition”, “single condition”, and “multiple conditions,” respectively.
- Physical activity was coded as: physically inactive or physically active. Physical activity was assessed based on WHO guidelines for persons aged 18 and above.[17] Older adults who performed at least 75 minutes of vigorous-intensity physical activity or at least 150 minutes of moderate-intensity physical activity in a day or a combination of both were classified as “physically active.” Otherwise, they were categorized as “physically inactive”.
- Difficulty in Activities of Daily Living (ADL) included items on whether older adults experienced any difficulty with the following six activities: (a) walking across a room, (b) dressing, (c) bathing, (d) eating, (e) getting in and out of bed, and (f) toileting. Responses for the six items (1 = yes; 0 = no) were summed, with higher scores indicating more activity limitations (range: 0–6). Older individuals who struggled with activities for more than three months were labeled “faces difficulties.” The “no difficulty” group comprised those with no trouble with any of the ADLs. We included ADLs given that difficulty in everyday functioning and independence can be crucial for one’s life satisfaction.
- Difficulty in Instrumental Activities of Daily Living (IADL) included items on whether older adults experienced any difficulty when performing the following seven activities: grocery shopping, preparing meals, making phone calls, taking medication, doing household chores, managing finances, and getting oneself to an otherwise unfamiliar location. Each item response was coded as 0 = no difficulty or 1 = any difficulty. Those who reported trouble with any of these activities for more than three months were labeled “faces difficulties.” Otherwise, they were categorized as having “no difficulty.” Even though IADLs may not require hands-on-personal assistance, difficulty in executing IADLs may compromise independent living, which could adversely affect life satisfaction.
- Covered by any health insurance was coded as yes, no.
Further, we considered the following household-related characteristics –
- Based on recommendations for “better” indicators of SES in LMICs[18]older adults’ SES was assessed using the monthly per-capita consumption expenditure (MPCE) quintile. Sets of 11 and 29 questions on the expenditures on food and non-food items, respectively, were used to canvass the sample households. Food expenditure was collected based on a reference period of seven days, while the non-food expenditure was collected using reference periods of 30 days and 365 days.[19] Food and non-food expenditures have been standardized to the 30-day reference period. The income quintile variable was divided into five quintiles i.e., from poorest to richest.
- Religious affiliation was coded as Hinduism, Islam, and Others.
- Given the documented link between poorer health and lower SES among certain castes,[20] we also included respondent’s self-reported social group, and categories were Scheduled Tribe (ST), Scheduled Caste (SC), Other Backward Class (OBC) and Others.
- The place of residence was coded as rural or urban.
- The region of residence (south, north, central, western, eastern, and north-eastern) was also included as a covariate in the analyses to assess regional disparities. This variable was constructed by including the 29 states and six union territories of India during 2017-18[21] into six categories based on administrative similarity.
Statistical Methods
We began by showing older adults’ absolute and percentage distributions based on their background characteristics. Bivariate analysis examined variations in older adults’ average life satisfaction score by their background characteristics. Additionally, one-way ANOVA tests were used to discern the difference in average life satisfaction scores across the independent variables. Further, multivariable linear regression analysis was used to examine the associations between the life satisfaction score and the independent variables. The partial correlation coefficients in regression models showed the difference in the life satisfaction score of older adults belonging to a specific category compared to older adults from the reference category, given that the effect of all the other independent variables remains constant.[22]
Next, dominance analysis (DA)[23] was used to determine the relative importance of independent variables in explaining the variation in the outcome variable.[24] Here, we used the DA method developed by Budescu with the older adults’ life satisfaction score as the outcome variable.[25] The DA computed sub-regression models with the same outcome variable and different sets of independent variables to determine the contribution of each predictor to the overall model prediction power denoted by the coefficient of determination statistic (R^2^). The DA gives the dominance statistic that denotes the prediction power of each predictor, the percentage variation in older adults’ life satisfaction explained by each predictor and ranks showing the relative importance of each predictor variable.[26]
Our background checks showed that the regression models did not violate the multicollinearity and heteroscedasticity assumptions. Standard errors were corrected for weighting and clustering in all estimations, given that LASI utilized a multistage sampling strategy.
Results
| Characteristics | All older adults | |
|---|---|---|
| N | % | |
| Age group | ||
| Young-old | 18,755 | 60.9 |
| Old-old | 8,898 | 28.9 |
| Oldest-old | 3,142 | 10.2 |
| Gender | ||
| Male | 14,785 | 48.0 |
| Female | 16,010 | 52.0 |
| Level of education | ||
| No formal education | 16,514 | 53.6 |
| Up to primary | 7,417 | 24.1 |
| Secondary and above | 6,864 | 22.3 |
| Working status | ||
| Currently working | 8,861 | 28.8 |
| Currently not working | 10,558 | 34.3 |
| Never worked | 8,751 | 28.4 |
| Retired | 2,625 | 8.5 |
| Current marital status | ||
| Currently not married | 11,146 | 36.2 |
| Currently married | 19,649 | 63.8 |
| Importance of religion | ||
| Not important | 5,979 | 19.4 |
| Very important | 24,816 | 80.6 |
| Living arrangement satisfaction | ||
| Not satisfied | 1,421 | 4.6 |
| Neutral | 5,248 | 17.0 |
| Satisfied | 24,126 | 78.3 |
| Received ill-treatment | ||
| Yes | 1,267 | 4.1 |
| No | 29,528 | 95.9 |
| Faces discrimination in life | ||
| Yes | 4,750 | 15.4 |
| No | 26,045 | 84.6 |
| Social participation | ||
| Socially inactive | 2,474 | 8.0 |
| Socially active | 28,321 | 92.0 |
| Depression symptoms | ||
| Depressed | 2,104 | 6.8 |
| Not depressed | 28,691 | 93.2 |
| Self-rated health | ||
| Poor | 6,686 | 21.7 |
| Average | 19,624 | 63.7 |
| Good | 4,485 | 14.6 |
| Chronic morbidity status | ||
| No condition | 14,079 | 45.7 |
| Single condition | 9,134 | 29.7 |
| Multiple conditions | 7,582 | 24.6 |
| Physical activity status | ||
| Physically active | 7,984 | 25.9 |
| Physically inactive | 22,811 | 74.1 |
| Difficulty in ADL | ||
| Faces difficulty | 6,295 | 20.4 |
| No difficulty | 24,500 | 79.6 |
| Difficulty in IADL | ||
| Faces difficulty | 13,359 | 43.4 |
| No difficulty | 17,436 | 56.6 |
| Covered by health insurance | ||
| No | 24,355 | 79.1 |
| Yes | 6,440 | 20.9 |
| Household income quintile | ||
| Poor | 12,656 | 41.1 |
| Not poor | 18,139 | 58.9 |
| Religion of household | ||
| Hinduism | 22,528 | 73.2 |
| Islam | 3,582 | 11.6 |
| Others | 4,685 | 15.2 |
| Caste of household | ||
| SC-ST group | 10,111 | 32.8 |
| Non-SC-ST group | 20,684 | 67.2 |
| Place of residence | ||
| Rural | 20,383 | 66.2 |
| Urban | 10,412 | 33.8 |
| Country Region | ||
| Southern | 7,291 | 23.7 |
| Northern | 7,726 | 25.1 |
| Central | 2,017 | 6.5 |
| Western | 4,133 | 13.4 |
| Eastern | 5,601 | 18.2 |
| North-eastern | 4,027 | 13.1 |
| Aggregate number | 30,795 | 100.0 |
Note – (a) N: Unweighted sample size, %: Unweighted percentage; (b) ADL: Activities of daily living, IADL: Instrumental activities of daily living.
Table 5.1 presents an overview of the socioeconomic and demographic characteristics of the study participants. The distribution reveals that 11% of the older adults fell into the oldest-old age group, with 59% categorized as young-old and 30% as old-old. Approximately 53% of the participants were women. Notably, 56% had not pursued formal education, while 21% had attained secondary or higher education levels. In terms of employment status, 7% were retired, while nearly 31% were currently working. Furthermore, 38% were not currently married, and for 21% of the participants, religion held no importance. Concerningly, 6% expressed dissatisfaction with their current living arrangements. Instances of ill treatment were reported by 5% of respondents, while 18% reported experiencing discrimination at some point. Social inactivity affected almost 9% of participants, with a similar proportion experiencing depression. Moreover, 23% rated their health as poor, and 24% reported having multiple health conditions. Physical inactivity was prevalent among 72% of older adults, and 23% faced difficulty with Activities of Daily Living (ADL), while 48% encountered challenges with Instrumental Activities of Daily Living (IADL). Alarmingly, only 18% had health insurance coverage.
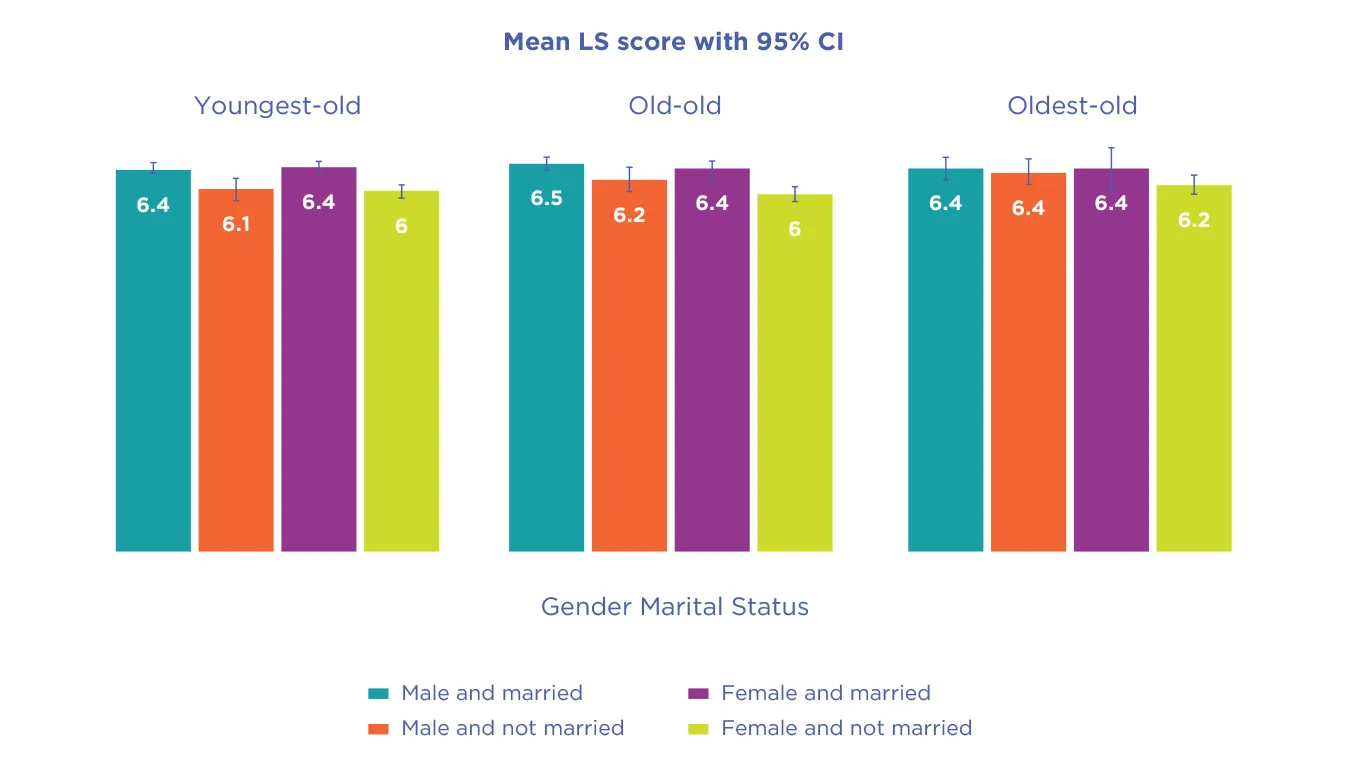
Figure 5.1 represents the bar plot for life satisfaction score by gender and marital status among older adults. In all age groups, unmarried women reported the lowest levels of life satisfaction.
| Characteristics | Life satisfaction score of older adults | ||
|---|---|---|---|
| Mean | SD | ANOVA statistic (p-value) | |
| Age group | |||
| Young-old | 6.3 | 2.4 | 1.17 (0.3111) |
| Old-old | 6.3 | 2.4 | |
| Oldest-old | 6.3 | 2.4 | |
| Gender | |||
| Male | 6.4 | 2.4 | 43.60 (<0.001) |
| Female | 6.2 | 2.4 | |
| Level of education | |||
| No formal education | 6.0 | 2.4 | 438.18 (<0.001) |
| Up to primary | 6.4 | 2.3 | |
| Secondary and above | 7.0 | 2.3 | |
| Working status | |||
| Currently working | 6.2 | 2.4 | 139.50 (<0.001) |
| Currently not working | 6.1 | 2.5 | |
| Never worked | 6.3 | 2.4 | |
| Retired | 7.2 | 2.2 | |
| Current marital status | |||
| Currently not married | 6.1 | 2.5 | 162.34 (<0.001) |
| Currently married | 6.4 | 2.4 | |
| Importance of religion | |||
| Not important | 5.7 | 2.5 | 511.95 (<0.001) |
| Very important | 6.5 | 2.4 | |
| Living arrangement satisfaction | |||
| Not satisfied | 3.8 | 2.6 | 1836.82 (<0.001) |
| Neutral | 5.2 | 2.4 | |
| Satisfied | 6.7 | 2.2 | |
| Received ill-treatment | |||
| Yes | 5.0 | 2.7 | 373.07 (<0.001) |
| No | 6.4 | 2.4 | |
| Faces discrimination in life | |||
| Yes | 5.5 | 2.5 | 740.61 (<0.001) |
| No | 6.5 | 2.4 | |
| Social participation | |||
| Socially inactive | 5.9 | 2.8 | 94.96 (<0.001) |
| Socially active | 6.4 | 2.4 | |
| Depression symptoms | |||
| Depressed | 5.2 | 2.7 | 492.64 (<0.001) |
| Not depressed | 6.4 | 2.4 | |
| Self-rated health | |||
| Poor | 5.6 | 2.6 | 465.96 (<0.001) |
| Average | 6.4 | 2.3 | |
| Good | 6.9 | 2.3 | |
| Chronic morbidity status | |||
| No condition | 6.3 | 2.4 | 4.08 (0.0169) |
| Single condition | 6.3 | 2.4 | |
| Multiple conditions | 6.4 | 2.5 | |
| Physical activity status | |||
| Physically active | 6.3 | 2.3 | 4.67 (0.0306) |
| Physically inactive | 6.3 | 2.4 | |
| Difficulty in ADL | |||
| Faces difficulty | 6.0 | 2.5 | 98.13 (<0.001) |
| No difficulty | 6.4 | 2.4 | |
| Difficulty in IADL | |||
| Faces difficulty | 6.0 | 2.4 | 411.81 (<0.001) |
| No difficulty | 6.6 | 2.4 | |
| Covered by health insurance | |||
| No | 6.4 | 2.4 | 43.08 (<0.001) |
| Yes | 6.1 | 2.5 | |
| Household income quintile | |||
| Poor | 6.1 | 2.4 | 163.82 (<0.001) |
| Not poor | 6.5 | 2.4 | |
| Religion of household | |||
| Hinduism | 6.3 | 2.5 | 25.38 (<0.001) |
| Islam | 6.2 | 2.3 | |
| Others | 6.5 | 2.2 | |
| Caste of household | |||
| SC-ST group | 6.1 | 2.3 | 109.18 (<0.001) |
| Non-SC-ST group | 6.4 | 2.4 | |
| Place of residence | |||
| Rural | 6.1 | 2.4 | 307.40 (<0.001) |
| Urban | 6.7 | 2.4 | |
| Country region | |||
| Southern | 6.0 | 2.6 | 214.00 (<0.001) |
| Northern | 6.3 | 2.3 | |
| Central | 6.3 | 2.6 | |
| Western | 7.3 | 2.2 | |
| Eastern | 5.9 | 2.3 | |
| North-eastern | 6.5 | 2.0 | |
| Overall life satisfaction score | 6.3 | 2.4 | |
Note – (a) Mean: Average life satisfaction score, SD: Standard deviation; (b) ADL: Activities of daily living, IADL: Instrumental activities of daily living.
In Table 5.2, we delve into the life satisfaction of older adults based on their backgrounds. Notably, women consistently reported lower life satisfaction than men, while those without formal education tended to show significantly lower satisfaction compared to their educated peers. Retirement seemed to correlate with lower satisfaction levels, contrasting with those still in the workforce. Interestingly, unmarried individuals, those less concerned with religion, and those discontent with their living situations displayed notably lower satisfaction scores. Moreover, experiences of ill-treatment or discrimination, social inactivity, depression, poor self-rated health, and difficulties with daily activities were all linked to diminished life satisfaction among older adults. Financial status, caste, and rural residence also emerged as influential factors, with those from the western region of India reporting the highest satisfaction levels, followed by counterparts in the central, north-eastern, and northern regions.
| Characteristics | Life satisfaction of older adults | ||
|---|---|---|---|
| Coef | 95% CI | p-value | |
| Age group | |||
| Young-old | (ref) | ||
| Old-old | 0.090 | (0.031, 0.149) | 0.003 |
| Oldest-old | 0.241 | (0.150, 0.332) | <0.001 |
| Gender | |||
| Male | (ref) | ||
| Female | 0.085 | (0.017, 0.153) | 0.014 |
| Level of education | |||
| No formal education | (ref) | ||
| Up to primary | 0.214 | (0.146, 0.283) | <0.001 |
| Secondary and above | 0.697 | (0.616, 0.778) | <0.001 |
| Working status | |||
| Currently working | (ref) | ||
| Currently not working | -0.023 | (-0.093, 0.047) | 0.525 |
| Never worked | 0.138 | (0.054, 0.222) | 0.001 |
| Retired | 0.255 | (0.140, 0.370) | <0.001 |
| Current marital status | |||
| Currently not married | (ref) | ||
| Currently married | 0.126 | (0.067, 0.185) | <0.001 |
| Importance of religion | |||
| Not important | (ref) | ||
| Very important | 0.218 | (0.153, 0.283) | <0.001 |
| Living arrangement satisfaction | |||
| Not satisfied | (ref) | ||
| Neutral | 1.107 | (0.984, 1.229) | <0.001 |
| Satisfied | 2.270 | (2.154, 2.385) | <0.001 |
| Received ill-treatment | |||
| Yes | (ref) | ||
| No | 0.368 | (0.248, 0.488) | <0.001 |
| Faces discrimination in life | |||
| Yes | (ref) | ||
| No | 0.511 | (0.440, 0.582) | <0.001 |
| Social participation | |||
| Socially inactive | (ref) | ||
| Socially active | 0.086 | (-0.007, 0.178) | 0.071 |
| Depression symptoms | |||
| Depressed | (ref) | ||
| Not depressed | 0.647 | (0.553, 0.741) | <0.001 |
| Self-rated health | |||
| Poor | (ref) | ||
| Average | 0.388 | (0.322, 0.454) | <0.001 |
| Good | 0.521 | (0.427, 0.616) | <0.001 |
| Chronic morbidity status | |||
| No condition | (ref) | ||
| Single condition | -0.034 | (-0.095, 0.027) | 0.274 |
| Multiple conditions | 0.107 | (0.037, 0.177) | 0.003 |
| Physical activity status | |||
| Physically active | (ref) | ||
| Physically inactive | 0.016 | (-0.046, 0.079) | 0.614 |
| Difficulty in ADL | |||
| Faces difficulty | (ref) | ||
| No difficulty | 0.278 | (0.209, 0.346) | <0.001 |
| Difficulty in IADL | |||
| Faces difficulty | (ref) | ||
| No difficulty | -0.038 | (-0.096, 0.021) | 0.209 |
| Covered by health insurance | |||
| No | (ref) | ||
| Yes | -0.217 | (-0.284, -0.149) | <0.001 |
| Household income quintile | |||
| Poor | (ref) | ||
| Not poor | 0.190 | (0.137, 0.243) | <0.001 |
| Religion of household | |||
| Hinduism | (ref) | ||
| Islam | 0.023 | (-0.062, 0.107) | 0.601 |
| Others | 0.012 | (-0.093, 0.117) | 0.821 |
| Caste of household | |||
| SC-ST group | (ref) | ||
| Non-SC-ST group | 0.196 | (0.134, 0.258) | <0.001 |
| Place of residence | |||
| Rural | (ref) | ||
| Urban | 0.047 | (-0.017, 0.111) | 0.150 |
| Country region | |||
| Southern | (ref) | ||
| Northern | 0.266 | (0.187, 0.345) | <0.001 |
| Central | 0.647 | (0.540, 0.754) | <0.001 |
| Western | 1.327 | (1.241, 1.413) | <0.001 |
| Eastern | 0.277 | (0.197, 0.357) | <0.001 |
| North-eastern | 0.485 | (0.327, 0.644) | <0.001 |
| Adjusted R-squared | 0.209 | ||
| Analytical sample size | 30,795 | ||
Note – (a) Coef: Partial correlation coefficients, CI: Confidence Interval, (ref): Reference category; (b) ADL: Activities of daily living, IADL: Instrumental activities of daily living.
In Table 5.3, we present the multivariable regression estimates adjusting for various socioeconomic and demographic characteristics to determine their associations with life satisfaction among older adults. Our findings indicate that certain demographic and socioeconomic factors are significantly associated with higher life satisfaction scores. Specifically, older adults categorized as ‘oldest-old’ exhibited a significantly greater likelihood of higher life satisfaction compared to those classified as ‘young-old’ (Coefficient: 0.241). Additionally, older women, individuals with secondary education or higher, currently married respondents, and those who considered religion as very important demonstrated a significantly higher likelihood of reporting higher life satisfaction scores compared to their respective counterparts. Moreover, individuals who reported satisfaction with their current living arrangements (Coefficient: 2.218), those who did not experience ill treatment (Coefficient: 0.368) or discrimination (Coefficient: 0.511), those who were not depressed (Coefficient: 0.647), and those who rated their health as good (Coefficient: 0.521) all exhibited significantly higher likelihoods of having higher life satisfaction scores. Furthermore, older adults from non-poor households (Coefficient: 0.190), Non-Scheduled Caste/Tribe backgrounds (Coefficient: 0.196), and those residing in western regions of India (Coefficient: 1.327) also demonstrated significantly higher likelihoods of reporting higher life satisfaction scores compared to their respective counterparts from other demographic and socioeconomic backgrounds.
Fig. 5.2: Contribution (%) of independent variable to overall variation in Life Satisfaction among older adults in India during 2017–18
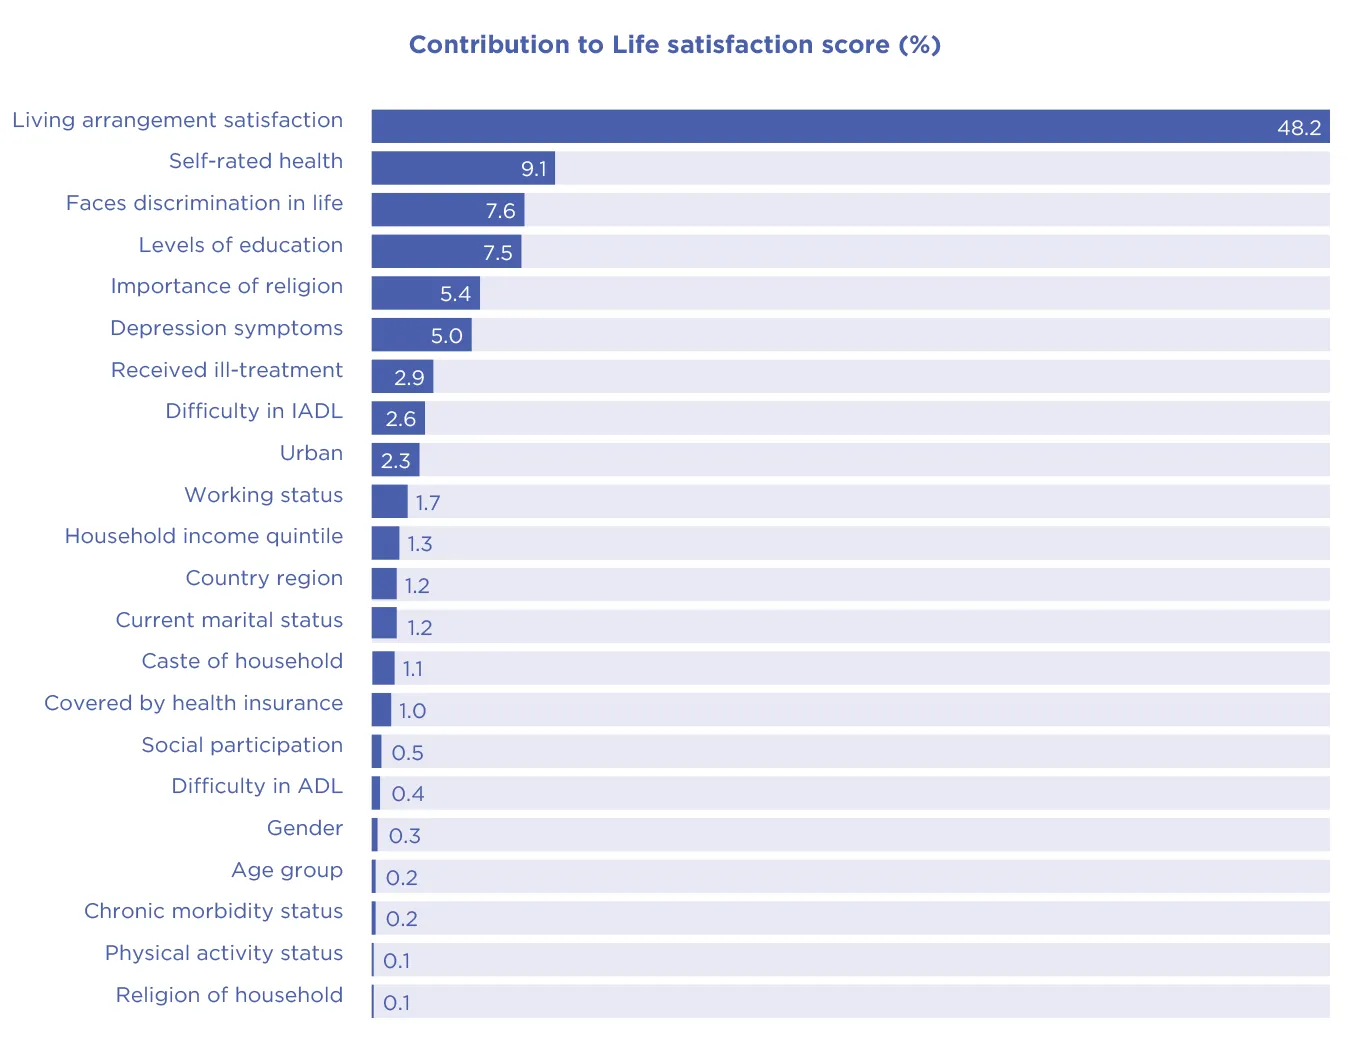
Figure 5.2 shows the relative importance of independent variables in predicting the life satisfaction score of older adults. The independent variables collectively explained away 15.8% of the variation in life satisfaction. We observed that satisfaction with living arrangements (rank 1), self-rated health (rank 2) and perceived discrimination (rank 3) were the top 3 predictors of life satisfaction among older adults. These three variables accounted for 65% of the variation in older adults’ life satisfaction scores. On the contrary, the dominance analysis output showed that gender, age, morbidity status, physical activity and religion ranked 18th, 19th, 20th, 21st, and 22nd (of the 22 independent variables) in their influence on life satisfaction among older Indians. These relatively non-significant life satisfaction score predictors accounted for 0.9% of the predicted variance.
Discussion
Subjective well-being (SWB) can be characterized as a favorable assessment of one’s life coupled with positive affect. In the field of gerontology, overall SWB is commonly assessed using evaluations of happiness, self-esteem, and life satisfaction. While happiness usually reflects the emotional facet of SWB, self-esteem and life satisfaction capture the cognitive appraisal of one’s sense of self and life overall.[27]
Gender and Life Satisfaction
Empirical research on gender and life satisfaction in later life has yielded mixed findings.[28] Some studies have found older women to report higher life satisfaction than older men,[29] others have found older women to report lower life satisfaction than their male peers,[30] and yet others observed no significant gender difference in life satisfaction.[31] In the present study, we find that older women in India have higher levels of life satisfaction than older men.
This is somewhat surprising given that women are exposed to more everyday life stressors (e.g., workplace discrimination; secondary social status within families and society at large) and are considered to be more susceptible to them.[32] Some studies[33] have found women’s disadvantages in health contribute towards their lower life satisfaction compared to older men.[34] For instance, although women outlive men, they have lower levels of mental and physical health and a greater burden of later life sickness and disability, possibly lowering their satisfaction with life.[35] Previous research has identified different factors that impact life satisfaction disparately for women and men. One study[36] found monthly income to affect life satisfaction only among older women while others found that having adequate income affected the life satisfaction among both women and men.[37] Likewise, research has reported on the role’s education, marital status, religion, depression, and physical activity and exercise play in gender differentials in life satisfaction.[38]
In the present study, we find that older women in India have higher levels of life satisfaction than older men.
One factor that may contribute to older women’s greater life satisfaction relative to older men is social resources, namely social support. Women, in general, possess wider and more diverse social networks, including a greater number of friends and confidants,[39] which likely translates into not only more social support but diverse forms of it. Men, alternatively, report fewer intimate social relationships and mostly rely on their spouses for support with far fewer people they deem to be their confidants.[40] Older women in India, especially of older cohorts, also may have invested more in building and maintaining family ties (e.g., organizing gatherings, writing holiday and birthday cards, doing physical and emotional care work) while older Indian men may have shouldered the responsibility of building family finances.[41] Gendered division of labor of this nature may explain differences in support later in life, which may reflect gender differences in life satisfaction with older women reporting to be more satisfied with life than their older male peers.
Age and Life Satisfaction
Given the social, functional, and cognitive losses tied to aging, the general public, including older adults themselves believe that life satisfaction decreases with advancing age.[42] Yet, a number of empirical studies -- both cross-sectional and longitudinal -- have shown that life satisfaction either rises or stays constant as one ages.[43] For instance, a meta-analysis of data from 145 countries reports a U-shaped linkage between age and life satisfaction in most countries, including 109 developing nations.[44]
In the present study, we find some interesting patterns. In the bivariate analysis, we find that life satisfaction was not associated with age of older adults. Other studies[45] have found similar patterns, where over 6 years, the overall level of life satisfaction declined among those aged 80 and above. Likewise, other authors have found that life satisfaction decreased among participants in their late 70s and 80s.[46] This may be because with increasing age, individuals experience increasing rates of disease and functional deficits,[47] declining social and physical activity,[48] increasing sensory limitations[49] and problems with memory, attention, and other cognitive functions.[50] Moreover, aging also is accompanied by loss of social roles, friends, and family. Such experiences can erode an individual’s sense of self-efficacy and self-worth. Reduced psychological resources of such nature, in turn, can lead to disengagement, depression, and apathy, all likely manifested in lowered satisfaction with one’s life.[51]
That said, at the multivariate level, upon controlling several conceptually relevant covariates, we found that increased age was accompanied by higher levels of life satisfaction. Several explanations have been offered to explain this finding, where despite the functional, physical, social, and cognitive losses, increasing age is accompanied by increasing life satisfaction.
Mirowsky’s “age as maturity” hypothesis[52] suggests that with age, people become experienced, accomplished, and mature, which translates into lower frustration, fewer negative emotions, less emptiness, and more life satisfaction. Based on Baltes and Baltes’ (1990) selective optimization with compensation theory,[53] some have argued that life satisfaction increases with age because older adults adopt accommodative strategies to maximize the gains and minimize the deficits, which help sustain or even improve satisfaction with life. Similarly, Carstensen’s (1999; 2006) socioemotional selectivity theory postulates that as people become more aware that time is limited, they learn to regulate their emotions, savor the most valuable moments in everyday life, and surround themselves with close friends and family, all of which may help sustain high levels of subjective well-being.[54] Relatedly, it is possible that, as found in one previous study,[55] individuals in this age group have acclimated to major life transitions, such as retirement, and are investing in personally and socially fulfilling activities, which may improve life satisfaction.
We also find that a greater proportion of older adults in our sample report being married and socially active, which may mean greater social and emotional support and reduced risk for loneliness, which remains a major risk factor for diminishing health and well-being.[56] Similarly, good mental and physical health also mean higher life satisfaction[57] and a greater proportion of older Indians in our study report not being depressed, having no difficulty in carrying out daily living activities, and either have no chronic illnesses or a single condition. Most also reported facing no discrimination or ill-treatment and being satisfied with their living situations. Recent studies have found older Indians to express a strong desire to “age in place,” as this may reflect the human urge to preserve autonomy, independence, and social bonds.[58] Unsurprisingly then, satisfaction with living arrangement emerges to be the highest contributory factor to life satisfaction in this study and this matches recent Indian studies, which find that living conditions and being satisfied with those conditions are consequential for later-life health.[59]
Taken together, the pattern found in this study surrounding age and life satisfaction refutes some claims that the positive association between age and life satisfaction only exists in high-income nations while life satisfaction declines with advancing age in countries that are socioeconomically constrained.
Taken together, the pattern found in this study surrounding age and life satisfaction refutes some claims that the positive association between age and life satisfaction only exists in high-income nations while life satisfaction declines with advancing age in countries that are socioeconomically constrained.[60] Our finding on age and life satisfaction also corroborates the findings in Chapter 2 of this report, which reveals an overall improvement in the levels of life satisfaction at higher ages in the global sample of older adults and among those living in South Asian countries. One way of extending the present research is to consider additional dimensions of subjective well-being. Although unlike several prior studies that are limited to single-item measurement of life satisfaction, we were able to measure this important marker of SWB using a multiple-item scale, future research replicating this work should consider employing multiple measures of subjective well-being, including happiness.[61] [62]
Educational Differences in Life Satisfaction
We found a significant association between educational status and life satisfaction among older adults in India. Older Indians with higher levels of education were significantly more satisfied with life compared to their peers without any formal education. Several social, health, and demographic factors could explain the educational differences in life satisfaction among older Indians.
For instance, while education may have an appreciable impact on quality of life, at least partly, through its link to material assets, such as employment and income, it also “develops habits, skills, resources, and abilities that enable people to achieve a better life,”[63] ultimately impacting life satisfaction. That education is positively associated with life satisfaction, in fact, is found in previous studies as well.[64]
Recent research in India also highlights that lack of education can decrease health care utilization and increase the likelihood of mental and physical illnesses,[65] which can negatively affect satisfaction with life in older ages. The educational differences in life satisfaction among older Indians in our study also could be interpreted in the light of recent research findings in India and other low- and middle-income countries that older adults with lower education endure a higher risk of depression than their peers with higher education.[66]
Future studies should consider mechanisms connecting educational attainment and life satisfaction among older Indians. One potential mechanism could be that those with more education have a more diverse social network,[67] which may translate into more diverse forms of support. Diversity in social networks also may mean interactions with different types of individuals and more diverse social activities, both of which could promote higher order processing leading to better cognitive health.[68] Diverse sources of social support and strong cognitive function may be consequential for older adults’ life satisfaction. Though grounded in prior research, these suppositions remain to be empirically tested within the context of aging in India.
Caste and Life Satisfaction
Like in the case of social class, caste can determine access to multiple flexible resources, including knowledge, power, prestige, and mainstream social connections.[69] These flexible resources, often available to higher social caste individuals, are consequential throughout the life course and particularly in later life because they can be mobilized to avoid risks, deploy protective strategies, and preserve and promote health and well-being.[70]
In the present study, we find a significant difference between the SC/ST and non-SC/ST groups. Compared to the SC/ST group, older Indians who belong to the non-SC/ST group were more satisfied with their life. At the multivariate level as well, those in the non-SC/ST group reported higher life satisfaction than their SC-ST peers, though the overall size of difference diminished after controlling for several social structural factors, including education, perceived discrimination, and experiences of ill-treatment. Corroborating previous studies, we find that the variations in life satisfaction between castes were strongly related to education. Satisfaction with one’s life often is the result of the cumulative advantages, which are influenced by education, both directly and indirectly through its linkage with social and economic resources of income, power, wealth, and mainstream social connections. In addition to education, we also find that older Indians who never experience discrimination or ill-treatment are more satisfied with their lives and that experiences of discrimination and ill-treatment contribute significantly to the caste-based discrepancies in life satisfaction.
These findings are not surprising given the enduring hold caste has on the lives of people in India.[71] There is ample research on caste-based discrepancies in financial distress, lack of access to quality health care and social services.[72] Given the stigma attached to lower social caste, studies also have found that SC/ST groups are significantly less likely to seek treatment for health conditions than their non-SC/ST counterparts.[73] One recent study found that various factors such as education, perceived social standing, and satisfaction with one’s living arrangements and place of residence contributed to the caste disparities in life satisfaction among older Indians.[74] Aside from this, research points out the psychological toll that stigma takes on those of lower social caste groups. Those socially deprived may experience reduced sense of self-worth and self-efficacy, increased feelings of anger, anxiety, depression, and envy, and withdrawal from social interactions and activities.[75] This ultimately can negatively affect satisfaction with life.[76]
Corroborating previous studies, we find that the variations in life satisfaction between castes were strongly related to education.
Conclusion
The present study substantially contributes to the literature on later-life subjective well-being in India. And we do so by employing a sizable, heterogenous, nationally representative sample of older Indians. We found that older men, those in the higher age groups, currently married, and those who were educated report higher life satisfaction compared to their respective peers. Lower satisfaction with living arrangements, perceived discrimination, and poor self-rated health were important factors associated with low life satisfaction among older Indians. Findings of this study indicate that strengthening family networks to ensure a comfortable living arrangement for older adults, men, widowed, and those without formal education in particular, and bolstering social networks to reduce discrimination may enhance well-being in older age.
References
Agarwal, A., Lubet, A., Mitgang, E., Mohanty, S., & Bloom, D. E. (2016). Population Aging in India: Facts, Issues, and Options (SSRN Scholarly Paper 2834212). [https://doi.org/10.2139/ssrn.2834212]
Antonucci, T. C., & Akiyama, H. (1987). An examination of sex differences in social support among older men and women. Sex Roles: A Journal of Research, 17(11–12), 737–749. [https://doi.org/10.1007/BF00287685]
Arokiasamy, P. (2016). G. Giridhar, K. M. Sathyanarayana, Sanjay Kumar, K. S. James and Moneer Alam (eds), Population Ageing in India, Cambridge University Press, Cambridge, 2014, Hardback, 250 pp., ISBN 13: 9781107073326. Ageing & Society, 36(2), 445–447. [https://doi.org/10.1017/S0144686X15001300]
Baltes, P. B., & Baltes, M. M. (1990). Psychological perspectives on successful aging: The model of selective optimization with compensation. In Successful aging: Perspectives from the behavioral sciences (pp. 1–34). Cambridge University Press. [https://doi.org/10.1017/CBO9780511665684.003]
Berg, A. I., Hoffman, L., Hassing, L. B., McClearn, G. E., & Johansson, B. (2009). What matters, and what matters most, for change in life satisfaction in the oldest-old? A study over 6 years among individuals 80+. Aging & Mental Health, 13(2), 191–201. [https://doi.org/10.1080/13607860802342227]
Bird, C. E., & Rieker, P. P. (2008). Gender and health: The effects of constrained choices and social policies (pp. xv, 256). Cambridge University Press.
Bishop, J. (2013). Networked: The New Social Operating System. International Journal of E-Politics, 4, 64–66. [https://doi.org/10.4018/jep.2013040106]
Blanchflower, D. G. (2021). Is happiness U-shaped everywhere? Age and subjective well-being in 145 countries. Journal of Population Economics, 34(2), 575–624. [https://doi.org/10.1007/s00148-020-00797-z]
Blanchflower, D. G., & Oswald, A. J. (2008). Is well-being U-shaped over the life cycle? Social Science & Medicine (1982), 66(8), 1733–1749. [https://doi.org/10.1016/j.socscimed.2008.01.030]
Borg, C., Fagerström, C., Balducci, C., Burholt, V., Ferring, D., Weber, G., Wenger, C., Holst, G., & Hallberg, I. R. (2008). Life satisfaction in 6 European countries: The relationship to health, self-esteem, and social and financial resources among people (Aged 65-89) with reduced functional capacity. Geriatric Nursing (New York, N.Y.), 29(1), 48–57. [https://doi.org/10.1016/j.gerinurse.2007.05.002]
Borooah, V. (2018). Caste, religion, and health outcomes in India, 2004-14. Economic and Political Weekly, 53, 65–73.
Brinda, E. M., Rajkumar, A. P., Attermann, J., Gerdtham, U. G., Enemark, U., & Jacob, K. S. (2016). Health, Social, and Economic Variables Associated with Depression Among Older People in Low and Middle Income Countries: World Health Organization Study on Global AGEing and Adult Health. The American Journal of Geriatric Psychiatry, 24(12), 1196–1208. [https://doi.org/10.1016/j.jagp.2016.07.016]
Budescu, D. V. (1993). Dominance analysis: A new approach to the problem of relative importance of predictors in multiple regression. Psychological Bulletin, 114(3), 542–551. [https://doi.org/10.1037/0033-2909.114.3.542]
Camacho, D., Lee, Y., Bhattacharya, A., Vargas, L. X., Kimberly, L., & Lukens, E. (2019). High Life Satisfaction: Exploring the Role of Health, Social Integration and Perceived Safety among Mexican Midlife and Older Adults. Journal of Gerontological Social Work, 62(5), 521–542. [https://doi.org/10.1080/01634372.2019.1621975]
Cameron, A., & Trivedi, P. (2005). Microeconometrics: Methods and Applications. [https://doi.org/10.1017/CBO9780511811241]
Carstensen, L. L., Fung, H. H., & Charles, S. T. (2003). Socioemotional Selectivity Theory and the Regulation of Emotion in the Second Half of Life. Motivation and Emotion, 27(2), 103–123. [https://doi.org/10.1023/A:1024569803230]
Carstensen, L. L., Turan, B., Scheibe, S., Ram, N., Ersner-Hershfield, H., Samanez-Larkin, G. R., Brooks, K. P., & Nesselroade, J. R. (2011). Emotional Experience Improves With Age: Evidence Based on Over 10 Years of Experience Sampling. Psychology and Aging, 26(1), 21–33. [https://doi.org/10.1037/a0021285]
Cavazzana, A., Röhrborn, A., Garthus-Niegel, S., Larsson, M., Hummel, T., & Croy, I. (2018). Sensory-specific impairment among older people. An investigation using both sensory thresholds and subjective measures across the five senses. PloS One, 13(8), e0202969. [https://doi.org/10.1371/journal.pone.0202969]
Chalam, K. S. (2007). Caste—Based Reservations and Human Development in India (First Edition). Sage India.
Chen, M., Fu, Y., & Chang, Q. (2022). Life satisfaction among older adults in urban China: Does gender interact with pensions, social support and self-care ability? Ageing & Society, 42(9), 2026–2045. [https://doi.org/10.1017/S0144686X20001877]
Cheng, S.-T., & Chan, A. C. M. (2006). Relationship with others and life satisfaction in later life: Do gender and widowhood make a difference? The Journals of Gerontology. Series B, Psychological Sciences and Social Sciences, 61(1), P46-53. [https://doi.org/10.1093/geronb/61.1.p46]
Chia, F., Huang, W.-Y., Huang, H., & Wu, C.-E. (2023). Promoting Healthy Behaviors in Older Adults to Optimize Health-Promoting Lifestyle: An Intervention Study. International Journal of Environmental Research and Public Health, 20(2), 1628. [https://doi.org/10.3390/ijerph20021628]
Cho, J., Martin, P., Poon, L. W., & Georgia Centenarian Study. (2015). Successful aging and subjective well-being among oldest-old adults. The Gerontologist, 55(1), 132–143. [https://doi.org/10.1093/geront/gnu074]
de Grip, A., Dupuy, A., Jolles, J., & van Boxtel, M. (2012). Retirement and Cognitive Development: Are the Retired Really Inactive? (SSRN Scholarly Paper 2149479). [https://doi.org/10.2139/ssrn.2149479]
Deaton, A. (2008). Income, Health, and Well-Being around the World: Evidence from the Gallup World Poll. Journal of Economic Perspectives, 22(2), 53–72. [https://doi.org/10.1257/jep.22.2.53]
Dey, S., Nambiar, D., Lakshmi, J. K., Sheikh, K., & Reddy, K. S. (2012). Health of the Elderly in India: Challenges of Access and Affordability. In Aging in Asia: Findings From New and Emerging Data Initiatives. National Academies Press (US). [https://www.ncbi.nlm.nih.gov/books/NBK109208/]
Diener, E., Emmons, R. A., Larsen, R. J., & Griffin, S. (1985). The Satisfaction With Life Scale. Journal of Personality Assessment, 49(1), 71–75. [https://doi.org/10.1207/s15327752jpa4901_13]
Diener, E., Oishi, S., & Lucas, R. E. (2009). Subjective Well-Being: The Science of Happiness and Life Satisfaction. In S. J. Lopez & C. R. Snyder (Eds.), The Oxford Handbook of Positive Psychology (pp. 186–194). Oxford University Press. [https://doi.org/10.1093/oxfordhb/9780195187243.013.0017]
Diener, E., & Ryan, K. (2009). Subjective well-being: A general overview. South African Journal of Psychology, 39(4), 391–406. [https://doi.org/10.1177/008124630903900402]
Diener, E., Suh, E. M., Lucas, R. E., & Smith, H. L. (1999). Subjective well-being: Three decades of progress. Psychological Bulletin, 125(2), 276–302. [https://doi.org/10.1037/0033-2909.125.2.276]
Enkvist, A., Ekström, H., & Elmståhl, S. (2012). What factors affect life satisfaction (LS) among the oldest-old? Archives of Gerontology and Geriatrics, 54(1), 140–145. [https://doi.org/10.1016/j.archger.2011.03.013]
Fischer, C. S., & Beresford, L. (2015). Changes in Support Networks in Late Middle Age: The Extension of Gender and Educational Differences. The Journals of Gerontology Series B: Psychological Sciences and Social Sciences, 70(1), 123–131. [https://doi.org/10.1093/geronb/gbu057]
Freedman, V. A., & Martin, L. G. (1998). Understanding trends in functional limitations among older Americans. American Journal of Public Health, 88(10), 1457–1462.
Freedman, V. A., Wolf, D. A., & Spillman, B. C. (2016). Disability-Free Life Expectancy Over 30 Years: A Growing Female Disadvantage in the US Population. American Journal of Public Health, 106(6), 1079–1085. [https://doi.org/10.2105/AJPH.2016.303089]
Grömping, U. (2007). Estimators of Relative Importance in Linear Regression Based on Variance Decomposition. The American Statistician, 61(2), 139–147. [https://doi.org/10.1198/000313007X188252]
Hansen, T., & Blekesaune, M. (2022). The age and well-being “paradox”: A longitudinal and multidimensional reconsideration. European Journal of Ageing, 19(4), 1277–1286. [https://doi.org/10.1007/s10433-022-00709-y]
Hatzenbuehler, M. L., Phelan, J. C., & Link, B. G. (2013). Stigma as a Fundamental Cause of Population Health Inequalities. American Journal of Public Health, 103(5), 813–821. [https://doi.org/10.2105/AJPH.2012.301069]
Henderson, A. K., Walsemann, K. M., & Ailshire, J. A. (2022). Religious Involvement and Cognitive Functioning at the Intersection of Race-Ethnicity and Gender Among Midlife and Older Adults. The Journals of Gerontology. Series B, Psychological Sciences and Social Sciences, 77(1), 237–248. [https://doi.org/10.1093/geronb/gbab034]
Hu, P., Wang, S., & Lee, J. (2017). Socioeconomic Gradients of Cardiovascular Risk Factors in China and India: Results from the China Health and Retirement Longitudinal Study and Longitudinal Aging Study in India. International Journal of Public Health, 62(7), 763–773. [https://doi.org/10.1007/s00038-017-0968-3]
Johri, A., & Anand, P. V. (2022). Life Satisfaction and Well-Being at the Intersections of Caste and Gender in India. Psychological Studies, 67(3), 317–331. https://doi.org/10.1007/s12646-022-00667-6
Kandapan, B., Pradhan, J., & Pradhan, I. (2023). Living arrangement of Indian elderly: A predominant predictor of their level of life satisfaction. BMC Geriatrics, 23(1), 88. https://doi.org/10.1186/s12877-023-03791-8
Kessler, R. C., Andrews, G., Mroczek, D., Ustun, B., & Wittchen, H.-U. (1998). The World Health Organization Composite International Diagnostic Interview short-form (CIDI-SF). International Journal of Methods in Psychiatric Research, 7(4), 171–185. [https://doi.org/10.1002/mpr.47]
Khodabakhsh, S. (2022). Factors Affecting Life Satisfaction of Older Adults in Asia: A Systematic Review. Journal of Happiness Studies, 23(3), 1289–1304. [https://doi.org/10.1007/s10902-021-00433-x]
Kim, J., Lee, M., & Dan, H. (2021). Gender Differences in Factors Affecting Life Satisfaction of the Elderly with Multimorbidity in Korea. Nursing Reports, 11(1), 54–63. [https://doi.org/10.3390/nursrep11010006]
Lacey, H. P., Smith, D. M., & Ubel, P. A. (2006). Hope I Die before I Get Old: Mispredicting Happiness Across the Adult Lifespan. Journal of Happiness Studies, 7(2), 167–182. [https://doi.org/10.1007/s10902-005-2748-7]
Lee, J., Meijer, E., Phillips, D., & Hu, P. (2021). Disability Incidence Rates for Men and Women in 23 Countries: Evidence on Health Effects of Gender Inequality. The Journals of Gerontology. Series A, Biological Sciences and Medical Sciences, 76(2), 328–338. [https://doi.org/10.1093/gerona/glaa288]
Lee, S.-H., Lee, J., & Choi, I. (2020). Life Satisfaction in Later Life: The Interplay of Marital Condition and Income among Elderly Koreans. Sustainability, 12(8), Article 8. [https://doi.org/10.3390/su12083483]
Li, L. W., Zhang, J., & Liang, J. (2009). Health among the Oldest-Old in China: Which Living Arrangements Make a Difference? Social Science & Medicine (1982), 68(2), 220–227. [https://doi.org/10.1016/j.socscimed.2008.10.013]
Link, B. G., & Phelan, J. (1995). Social conditions as fundamental causes of disease. Journal of Health and Social Behavior, Spec No, 80–94.
Luchman, J. N. (2021). Determining relative importance in Stata using dominance analysis: Domin and domme. The Stata Journal, 21(2), 510–538. [https://doi.org/10.1177/1536867X211025837]
Macia, E., Duboz, P., Montepare, J. M., & Gueye, L. (2015). Exploring Life Satisfaction Among Older Adults in Dakar. Journal of Cross-Cultural Gerontology, 30(4), 377–391. [https://doi.org/10.1007/s10823-015-9275-8]
Maresova, P., Javanmardi, E., Barakovic, S., Barakovic Husic, J., Tomsone, S., Krejcar, O., & Kuca, K. (2019). Consequences of chronic diseases and other limitations associated with old age – a scoping review. BMC Public Health, 19(1), 1431. [https://doi.org/10.1186/s12889-019-7762-5]
McDonough, P., & Walters, V. (2001). Gender and health: Reassessing patterns and explanations. Social Science & Medicine (1982), 52(4), 547–559. [https://doi.org/10.1016/s0277-9536(00)00159-3]
McLeod, J. D., & Kessler, R. C. (1990). Socioeconomic status differences in vulnerability to undesirable life events. Journal of Health and Social Behavior, 31(2), 162–172.
Meggiolaro, S., & Ongaro, F. (2015). Life satisfaction among older people in Italy in a gender approach. Ageing & Society, 35(7), 1481–1504. [https://doi.org/10.1017/S0144686X14000646]
Milanović, Z., Pantelić, S., Trajković, N., Sporiš, G., Kostić, R., & James, N. (2013). Age-related decrease in physical activity and functional fitness among elderly men and women. Clinical Interventions in Aging, 8, 549–556. [https://doi.org/10.2147/CIA.S44112]
Mirowsky, J., & Ross, C. E. (1992). Age and depression. Journal of Health and Social Behavior, 33(3), 187–205. [https://doi.org/10.2307/2137349]
Morgan, J., Robinson, O., & Thompson, T. (2015). Happiness and age in European adults: The moderating role of gross domestic product per capita. Psychology and Aging, 30(3), 544–551. [https://doi.org/10.1037/pag0000034]
Mroczek, D. K., & Spiro III, A. (2005). Change in Life Satisfaction During Adulthood: Findings From the Veterans Affairs Normative Aging Study. Journal of Personality and Social Psychology, 88(1), 189–202. [https://doi.org/10.1037/0022-3514.88.1.189]
Muhammad, T., Balachandran, A., & Srivastava, S. (2021). Socio-economic and health determinants of preference for separate living among older adults: A cross-sectional study in India. PLoS ONE, 16(4), e0249828. [https://doi.org/10.1371/journal.pone.0249828]
Muhammad, T., & Joy, A. M. (2022). Does childhood financial status relate to satisfaction in late life: Findings from the longitudinal aging study in India. Aging and Health Research, 2(1), 100054. [https://doi.org/10.1016/j.ahr.2022.100054]
Muhammad, T., Pai, M., Afsal, K., Saravanakumar, P., & Irshad, C. V. (2023). The association between loneliness and life satisfaction: examining spirituality, religiosity, and religious participation as moderators. BMC geriatrics, 23(1), 1-17.
Muhammad, T., Paul, R., Meher, T., Rashmi, R., & Srivastava, S. (2022). Decomposition of caste differential in life satisfaction among older adults in India. BMC Geriatrics, 22(1), 832. [https://doi.org/10.1186/s12877-022-03526-1]
Murman, D. L. (2015). The Impact of Age on Cognition. Seminars in Hearing, 36(3), 111–121. [https://doi.org/10.1055/s-0035-1555115]
Nagargoje, V. P., James, K. S., & Muhammad, T. (2022). Moderation of marital status and living arrangements in the relationship between social participation and life satisfaction among older Indian adults. Scientific Reports, 12(1), 20604
Nayar, K. R. (2007). Social exclusion, caste & health: A review based on the social determinants framework. The Indian Journal of Medical Research, 126(4), 355–363.
Ngoo, Y. T., Tey, N. P., & Tan, E. C. (2015). Determinants of Life Satisfaction in Asia. Social Indicators Research, 124(1), 141–156.
Okabayashi, S., Kawamura, T., Wakai, K., Ando, M., Tsushita, K., Ohira, H., Ukawa, S., & Tamakoshi, A. (2019). Lifestyle and psychosocial factors and a decline in competence in daily living among Japanese early elderly people: From an age-specified community-based cohort study (NISSIN project). Environmental Health and Preventive Medicine, 24, 28. [https://doi.org/10.1186/s12199-019-0787-7]
Pai, M., Muhammad, T., Das, S., Chaudhary, M., & Srivastava, S. (2023). Gender differences in the association between physical frailty and life satisfaction among older adults in India. Psychogeriatrics, 23(6), 930-943.
Papi, S., & Cheraghi, M. (2021). Multiple factors associated with life satisfaction in older adults. Przeglad Menopauzalny = Menopause Review, 20(2), 65–71. [https://doi.org/10.5114/pm.2021.107025]
Papi, S., Karimi, Z., Zilaee, M., & Shahry, P. (2019). Malnutrition and Its Relation to General Health and Multimorbidity in the Older People. Journal of Holistic Nursing And Midwifery, 29(4), 228–235. [https://doi.org/10.32598/JHNM.29.4.228]
Park, J.-H., & Kang, S.-W. (2022). Factors Related to Life Satisfaction of Older Adults at Home: A Focus on Residential Conditions. Healthcare, 10(7), Article 7. [https://doi.org/10.3390/healthcare10071279]
Paskulin, L. M. G., & Vianna, L. A. C. (2007). [Sociodemographic profile and self-referred health conditions of the elderly in a city of Southern Brazil]. Revista De Saude Publica, 41(5), 757–768. [https://doi.org/10.1590/s0034-89102007000500010]
Plouffe, L. (2010). M.J. Stones, Albert Kozma, and J.K. McNeil. Psychological Weil-Being in Later Life. Toronto: Butterworths, 1991, pp. 160. Canadian Journal on Aging / La Revue Canadienne Du Vieillissement, 11, 202–204. [https://doi.org/10.1017/S0714980800011740]
Prior, N. H., Bentz, E. J., & Ophir, A. G. (2022). Reciprocal processes of sensory perception and social bonding: An integrated social-sensory framework of social behavior. Genes, Brain and Behavior, 21(3), e12781. [https://doi.org/10.1111/gbb.12781]
Puvill, T., Lindenberg, J., de Craen, A. J. M., Slaets, J. P. J., & Westendorp, R. G. J. (2016). Impact of physical and mental health on life satisfaction in old age: A population based observational study. BMC Geriatrics, 16(1), 194. [https://doi.org/10.1186/s12877-016-0365-4]
Rhee, T. G., Marottoli, R. A., & Monin, J. K. (2021). Diversity of social networks versus quality of social support: Which is more protective for health-related quality of life among older adults? Preventive Medicine, 145, 106440. [https://doi.org/10.1016/j.ypmed.2021.106440]
Rosenberg, C. E. (1979). Conceiving The Self. Basic Books.
Ross, C. E., & Mirowsky, J. (2010). Why education is the key to socioeconomic differentials in health. Handbook of Medical Sociology, Sixth Edition, 33–51.
Roy, M., Bhatta, T., & Burnette, J. D. (2020). Intersectional Effects of Gender, Education, and Geographic Region on Functional Health Disparities Among Older Adults in India. Journal of Aging and Health, 32(9), 1188–1197. [https://doi.org/10.1177/0898264319899246]
Saravanakumar, P., Muhammad, T., & Srivastava, S. (2022). Cross-sectional associations of personal efforts and beliefs and depressive symptoms among older adults in India. Scientific Reports, 12(1), Article 1. [https://doi.org/10.1038/s41598-022-17578-1]
Schilling, O. (2006). Development of Life Satisfaction in Old Age: Another View on the “Paradox”. Social Indicators Research, 75(2), 241–271. [https://doi.org/10.1007/s11205-004-5297-2]
Selivanova, A., & Cramm, J. M. (2014). The relationship between healthy behaviors and health outcomes among older adults in Russia. BMC Public Health, 14(1), 1183. [https://doi.org/10.1186/1471-2458-14-1183]
Sharma, N., Chakrabarti, S., & Grover, S. (2016). Gender differences in caregiving among family—Caregivers of people with mental illnesses. World Journal of Psychiatry, 6(1), 7–17. [https://doi.org/10.5498/wjp.v6.i1.7]
Shye, D., Mullooly, J. P., Freeborn, D. K., & Pope, C. R. (1995). Gender differences in the relationship between social network support and mortality: A longitudinal study of an elderly cohort. Social Science & Medicine (1982), 41(7), 935–947. [https://doi.org/10.1016/0277-9536(94)00404-h]
Siedlecki, K. L., Tucker-Drob, E. M., Oishi, S., & Salthouse, T. A. (2008). Life satisfaction across adulthood: Different determinants at different ages? The Journal of Positive Psychology, 3(3), 153–164. [https://doi.org/10.1080/17439760701834602]
Silverstein, M., Cong, Z., & Li, S. (2006). Intergenerational transfers and living arrangements of older people in rural China: Consequences for psychological well-being. The Journals of Gerontology. Series B, Psychological Sciences and Social Sciences, 61(5), S256-266. [https://doi.org/10.1093/geronb/61.5.s256]
Social isolation, loneliness in older people pose health risks. (2019, April 23). National Institute on Aging. [https://www.nia.nih.gov/news/social-isolation-loneliness-older-people-pose-health-risks]
Srivastava, S., Muhammad, T., Sulaiman, K. M., Kumar, M., & Singh, S. K. (2022). Types of household headship and associated life satisfaction among older adults in India: Findings from LASI survey, 2017-18. BMC Geriatrics, 22(1), 78. [https://doi.org/10.1186/s12877-022-02772-7]
Srivastava, S., Purkayastha, N., Chaurasia, H., & Muhammad, T. (2021). Socioeconomic inequality in psychological distress among older adults in India: A decomposition analysis. BMC Psychiatry, 21(1), 179. [https://doi.org/10.1186/s12888-021-03192-4]
Srivastava, S., Shaw, S., Chaurasia, H., Purkayastha, N., & Muhammad, T. (2021). Feeling about living arrangements and associated health outcomes among older adults in India: A cross-sectional study. BMC Public Health, 21(1), 1322. [https://doi.org/10.1186/s12889-021-11342-2]
Swift, H. J., Vauclair, C.-M., Abrams, D., Bratt, C., Marques, S., & Lima, M.-L. (2014). Revisiting the Paradox of Well-being: The Importance of National Context. The Journals of Gerontology: Series B, 69(6), 920–929. https://doi.org/10.1093/geronb/gbu011
Trainor, K., Mallett, J., & Rushe, T. (2013). Age related differences in mental health scale scores and depression diagnosis: Adult responses to the CIDI-SF and MHI-5. Journal of Affective Disorders, 151(2), 639–645. [https://doi.org/10.1016/j.jad.2013.07.011]
The Longitudinal Ageing Study in India 2017-18—National report. (2020). International Institute for Population Sciences, National Programme for Health Care of Elderly, Ministry of Health and Family Welfare, Harvard T. H. Chan School of Public Health, and the University of Southern California.
Tobiasz-Adamczyk, B., Galas, A., Zawisza, K., Chatterji, S., Haro, J. M., Ayuso-Mateos, J. L., Koskinen, S., & Leonardi, M. (2017). Gender-related differences in the multi-pathway effect of social determinants on quality of life in older age—The COURAGE in Europe project. Quality of Life Research, 26(7), 1865–1878. [https://doi.org/10.1007/s11136-017-1530-8]
Ugargol, A. P., & Bailey, A. (2018). Family caregiving for older adults: Gendered roles and caregiver burden in emigrant households of Kerala, India. Asian Population Studies, 14(2), 194–210. [https://doi.org/10.1080/17441730.2017.1412593]
United Nations. (2020). Department of Economic and Social Affairs, Population Division. World Population Ageing 2019 ((ST/ESA/SER.A/444).).
Vijayakumar, G., Devi, E. S., & Jawahar, P. (2016). Life Satisfaction of Elderly in Families and Old Age Homes: A Comparative Study. International Journal of Nursing Education, 8(1), 94. [https://doi.org/10.5958/0974-9357.2016.00017.9]
Wettstein, M., Schilling, O. K., & Wahl, H.-W. (2016). “Still feeling healthy after all these years”: The paradox of subjective stability versus objective decline in very old adults’ health and functioning across five years. Psychology and Aging, 31(8), 815–830. [https://doi.org/10.1037/pag0000137]
Wettstein, M., Wahl, H.-W., & Schlomann, A. (2022). The Impact of the COVID-19 Pandemic on Trajectories of Well-Being of Middle-Aged and older Adults: A Multidimensional and Multidirectional Perspective. Journal of Happiness Studies, 23(7), 3577–3604. [https://doi.org/10.1007/s10902-022-00552-z]
Whitson, H. E., Landerman, L. R., Newman, A. B., Fried, L. P., Pieper, C. F., & Cohen, H. J. (2010). Chronic Medical Conditions and the Sex-based Disparity in Disability: The Cardiovascular Health Study. The Journals of Gerontology: Series A, 65A(12), 1325–1331. [https://doi.org/10.1093/gerona/glq139]
WHO. (2020). WHO guidelines on physical activity and sedentary behaviour: At a glance. [https://www.who.int/publications-detail-redirect/9789240014886]
Wu, T.-T., Chen, I.-J., Cho, S.-L., & Chiou, A.-F. (2016). The Relationship Between Health-Promoting Behaviors and Metabolic Syndrome in Community-Dwelling Older Adults. Biological Research for Nursing, 18(5), 549–557. [https://doi.org/10.1177/1099800416655882]
Zhang, L. (2015). Living Arrangements and Subjective Well-Being among the Chinese Elderly. Open Journal of Social Sciences, 3(3), Article 3. [https://doi.org/10.4236/jss.2015.33024]
Endnotes
See United Nations (2020) ↩︎
The average growth rate for Indians aged 60 and above is 300% higher than the overall population growth rate in India. See Agarwal et al. (2016) and Arokiasamy (2016) ↩︎
See Papi & Cheraghi (2021) ↩︎
See Diener et al. (1999), Mroczek & Spiro III (2005) and Park & Kang (2022) ↩︎
See Vijayakumar et al. (2016) ↩︎
See Chia et al. (2023), Selivanova & Cramm (2014) and Wu et al. (2016) ↩︎
See Papi et al. (2019) ↩︎
See Mroczek & Spiro III (2005), Park & Kang (2022) and Srivastava et al. (2022) ↩︎
See Khodabakhsh (2022) ↩︎
See Muhammad & Joy (2022), Nagargoje et al. (2022), Muhammad et al. (2023) and Pai et al. (2023). ↩︎
The University of Southern California (USC), the Harvard School of Public Health, and the International Institute for Population Sciences (IIPS) collaborated to conduct this nationally representative survey. ↩︎
See The Longitudinal Ageing Study in India 2017-18 - National Report (2020) ↩︎
In rural areas, the survey used a three-stage sample strategy, whereas in urban areas, a four-stage sampling design was used. The first stage in each state/UT required choosing Primary Sampling Units (PSUs), which are sub-districts (Tehsils/Talukas), and the second stage involved choosing villages in rural regions and wards in urban areas within the chosen PSUs. In the third step, households were chosen from various settlements in rural areas. Sampling in metropolitan areas required an additional measure. Specifically, one Census Enumeration Block (CEB) was chosen at random in each urban area in the third stage. Households from this CEB were chosen in the fourth stage. In the survey report, the detailed methodology was released, together with complete information on the survey design and data collection (30). Additional information about the survey instruments, fieldwork, data collecting and processing, response rates, and sample design is accessible to the public elsewhere.15 ↩︎
See Diener et al. (1985, 1999, 2009) ↩︎
This scale showed a high degree of internal consistency. Cronbach’s alpha value: 0.90 ↩︎
See Kessler et al. (1998) and Trainor et al. (2013) ↩︎
See WHO (2020) ↩︎
See Hu et al. (2017) ↩︎
See The Longitudinal Ageing Study in India 2017-18 - National Report (2020) ↩︎
See Borooah (2018) and Nayar (2007) ↩︎
Since then, the Indian state of Jammu and Kashmir has been divided to form two union territories of J&K and Ladakh. ↩︎
See Cameron & Trivedi (2005) ↩︎
The partial correlation coefficient (PCC) from the regression model and the General Dominance analysis estimates are two different measures. In simple terms, the PCC displays the strength of association between the life satisfaction score and independent variable(s). However, the DA reveals which independent variable is more important than others in explaining the life satisfaction score of older adults. ↩︎
See Budescu (1993) and Grömping (2007) ↩︎
See Budescu (1993) and Luchman (2021) ↩︎
See Luchman (2021) ↩︎
See Plouffe (2010) and Rosenberg (1979). ↩︎
See Kim et al. (2021) ↩︎
See Camacho et al. (2019), Kim et al. (2021), Macia et al. (2015) and Muhammad & Joy (2022) ↩︎
See Chen et al. (2022a, 2022b), Cheng & Chan (2006) and Okabayashi et al. (2019) ↩︎
See Meggiolaro & Ongaro (2015) ↩︎
See Bird & Rieker (2008), McDonough & Walters (2001) and McLeod & Kessler (1990) ↩︎
See Chen et al. (2022), Cheng & Chan (2006) and Tobiasz-Adamczyk et al. (2017) ↩︎
See Bramhankar et al. (2023), Camacho et al. (2019), Lee & Williams (2023), Mandi & Bansod (2023), Mekonnen et al. (2022) and Pai et al. (2023) ↩︎
See Freedman et al. (2016), J. Lee et al. (2021) and Whitson et al. (2010) ↩︎
See Kim et al. (2021) ↩︎
See S.-H. Lee et al. (2020) ↩︎
See Kim et al. (2021) and S.-H. Lee et al. (2020) ↩︎
See Paskulin & Vianna (2007) and Shye et al. (1995) ↩︎
See Antonucci & Akiyama (1987) ↩︎
See Sharma et al. (2016), Silverstein et al. (2006) and Ugargol & Bailey (2018) ↩︎
See Lacey et al. (2006) ↩︎
See Berg et al. (2009), Carstensen et al. (2011), Diener & Ryan (2009), Hansen & Blekesaune (2022), Schilling (2006), Siedlecki et al. (2008) and Wettstein et al. (2016, 2022) ↩︎
See Blanchflower (2021), Blanchflower & Oswald (2008), Hansen & Blekesaune (2022) ↩︎
See Berg et al. (2009) ↩︎
See Enkvist et al. (2012) and Mroczek & Spiro III (2005) ↩︎
See Freedman & Martin (1998) and Maresova et al. (2019) ↩︎
See Milanović et al. (2013) ↩︎
See Cavazzana et al. (2018) ↩︎
See Murman (2015) ↩︎
See Borg et al. (2008) ↩︎
See Mirowsky & Ross (1992) ↩︎
See Baltes & Baltes (1990) ↩︎
See Carstensen et al. (2003) ↩︎
See de Grip et al. (2012) ↩︎
See National Institute on Aging (2019) ↩︎
See Puvill et al. (2016) ↩︎
See Muhammad et al. (2021) and Puvill et al. (2016) ↩︎
See Kandapan et al. (2023) and Srivastava & Shaw, et al. (2021) ↩︎
See Deaton, (2008), Hansen & Blekesaune (2022), Morgan et al. (2015) and Swift et al. (2014) ↩︎
Though used interchangeably, happiness and life satisfaction are distinct with the former gauging transient experiences and the latter used to appraise whether one’s life has been successful overall ↩︎
Some also have argued in favor of assessing multiple domains of life satisfaction, including satisfaction with economic status, housing, health, neighborhood, social networks, and family relationships ↩︎
See Ross & Mirowsky (2010) ↩︎
See Berg et al. (2009), Cho et al. (2015), Kim et al. (2021) and Ngoo et al. (2015) ↩︎
See Roy et al. (2020), Srivastava & Purkayastha, et al. (2021) ↩︎
See Brinda et al. (2016) and Saravanakumar et al. (2022) ↩︎
See Fischer & Beresford (2015) ↩︎
See Bishop (2013), Henderson et al. (2022), Prior et al. (2022) and Rhee et al. (2021) ↩︎
See Hatzenbuehler et al. (2013) and Link & Phelan (1995) ↩︎
See Hatzenbuehler et al. (2013) and Link & Phelan (1995) ↩︎
See Borooah (2018), Chalam (2007) and Nayar (2007) ↩︎
See Li et al. (2009) and Zhang (2015) ↩︎
See Dey et al. (2012) ↩︎
See Muhammad et al. (2022) ↩︎
See Johri & Anand (2022) ↩︎
Given that LASI only collected data from community-dwelling adults, factors affecting life satisfaction among those residing in formal care institutions, including assisted living facilities and nursing homes remain to be determined. In addition to social group status, such as social caste, future work should consider the additional stressors faced by those older adults not being able to “age in place.” ↩︎